jsMath

Grafovi

""" Ilija Gavran """ 
       
# Sage koristi NetworkX grafove (Python) import networkx # http://networkx.lanl.gov/index.html 
       
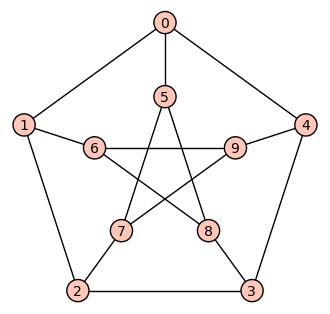
G = graphs.PetersenGraph() N = G.networkx_graph() 
       
N.adj 
       
{0: {1: {}, 4: {}, 5: {}}, 1: {0: {}, 2: {}, 6: {}}, 2: {1: {}, 3:
{}, 7: {}}, 3: {8: {}, 2: {}, 4: {}}, 4: {0: {}, 9: {}, 3: {}}, 5:
{0: {}, 8: {}, 7: {}}, 6: {8: {}, 1: {}, 9: {}}, 7: {9: {}, 2: {},
5: {}}, 8: {3: {}, 5: {}, 6: {}}, 9: {4: {}, 6: {}, 7: {}}}
G.show() 
       
# Zadavanje grafa d = {0: [1,4,5], 1: [2,6], 2: [3,7], 3: [4,8], 4: [9], 5: [7, 8], 6: [8,9], 7: [9]} # preko rjecnika G = Graph(d); G G.show() 
       
K = networkx.complete_bipartite_graph(12,7) # generiranje pomocu networkx paketa G = Graph(K) G.degree() 
       
[7, 7, 7, 7, 7, 7, 7, 7, 7, 7, 7, 7, 12, 12, 12, 12, 12, 12, 12]
G.show3d() 
       
You do not have the
Java Runtime Environment
installed for applet support.
Visit www.java.com
Get Image
M = Matrix([(0,1,0,0,1,1,0,0,0,0),(1,0,1,0,0,0,1,0,0,0), \ (0,1,0,1,0,0,0,1,0,0), (0,0,1,0,1,0,0,0,1,0),(1,0,0,1,0,0,0,0,0,1), \ (1,0,0,0,0,0,0,1,1,0), (0,1,0,0,0,0,0,0,1,1),(0,0,1,0,0,1,0,0,0,1), \ (0,0,0,1,0,1,1,0,0,0), (0,0,0,0,1,0,1,1,0,0)]) G = Graph(M); M # zadavanje matricom susjedstva 
       
[0 1 0 0 1 1 0 0 0 0]
[1 0 1 0 0 0 1 0 0 0]
[0 1 0 1 0 0 0 1 0 0]
[0 0 1 0 1 0 0 0 1 0]
[1 0 0 1 0 0 0 0 0 1]
[1 0 0 0 0 0 0 1 1 0]
[0 1 0 0 0 0 0 0 1 1]
[0 0 1 0 0 1 0 0 0 1]
[0 0 0 1 0 1 1 0 0 0]
[0 0 0 0 1 0 1 1 0 0]
G.show() 
       
M = Matrix([(-1,0,0,0,1,0,0,0,0,0,-1,0,0,0,0), \ (1,-1,0,0,0,0,0,0,0,0,0,-1,0,0,0),(0,1,-1,0,0,0,0,0,0,0,0,0,-1,0,0), \ (0,0,1,-1,0,0,0,0,0,0,0,0,0,-1,0),(0,0,0,1,-1,0,0,0,0,0,0,0,0,0,-1), \ (0,0,0,0,0,-1,0,0,0,1,1,0,0,0,0),(0,0,0,0,0,0,0,1,-1,0,0,1,0,0,0), \ (0,0,0,0,0,1,-1,0,0,0,0,0,1,0,0),(0,0,0,0,0,0,0,0,1,-1,0,0,0,1,0), \ (0,0,0,0,0,0,1,-1,0,0,0,0,0,0,1)]) G = Graph(M); M # zadavanje matricom incidencije 
       
[-1  0  0  0  1  0  0  0  0  0 -1  0  0  0  0]
[ 1 -1  0  0  0  0  0  0  0  0  0 -1  0  0  0]
[ 0  1 -1  0  0  0  0  0  0  0  0  0 -1  0  0]
[ 0  0  1 -1  0  0  0  0  0  0  0  0  0 -1  0]
[ 0  0  0  1 -1  0  0  0  0  0  0  0  0  0 -1]
[ 0  0  0  0  0 -1  0  0  0  1  1  0  0  0  0]
[ 0  0  0  0  0  0  0  1 -1  0  0  1  0  0  0]
[ 0  0  0  0  0  1 -1  0  0  0  0  0  1  0  0]
[ 0  0  0  0  0  0  0  0  1 -1  0  0  0  1  0]
[ 0  0  0  0  0  0  1 -1  0  0  0  0  0  0  1]
G.show() 
       
G = Graph([(1,3),(3,8),(5,2)]) # zadavanje popisom bridova G.show() 
       
# za cesto koristene grafove, vidjeti graphs.[tab] 
       
G = graphs.HouseXGraph() G.show() 
       
G.incidence_matrix() 
       
[-1 -1 -1  0  0  0  0  0]
[ 0  0  1 -1 -1  0  0  0]
[ 0  1  0  0  1 -1 -1  0]
[ 1  0  0  1  0  0  1 -1]
[ 0  0  0  0  0  1  0  1]
G.adjacency_matrix() 
       
[0 1 1 1 0]
[1 0 1 1 0]
[1 1 0 1 1]
[1 1 1 0 1]
[0 0 1 1 0]
G=graphs.HexahedralGraph() G.show() # G.show3d() # view(G) - prikaz pomocu LaTeX-a # latex(G) - generiranje LaTeX koda za prikaz grafa G 
       
G.clique_maximum(); G.clique_number() # primjer algoritma na grafu, ima ih mnogo 
       
[6, 7]
2
# pretrazivanje grafova po nekom zadanom kriteriju GraphQuery? 
       

File: /opt/sage/local/lib/python2.6/site-packages/sage/graphs/graph_database.py

Type: <type ‘type’>

Definition: GraphQuery( [noargspec] )

Docstring:

A query for an instance of GraphDatabase. This class nicely wraps the SQLQuery class located in sage.databases.database.py to make the query constraints intuitive and with as many pre-definitions as possible. (i.e.: since it has to be a GraphDatabase, we already know the table structure and types; and since it is immutable, we can treat these as a guarantee).

Note

SQLQuery functions are available for GraphQuery. See sage.dataabases.database.py for more details.

INPUT:

  • graph_db - The GraphDatabase instance to apply the query to. (If None, then a new instance is created).
  • query_dict - A dictionary specifying the query itGraphQuery. Format is: ‘table_name’: ‘tblname’, ‘display_cols’: [‘col1’, ‘col2’], ‘expression’:[col, operator, value] If not None, query_dict will take precedence over all other arguments.
  • display_cols - A list of column names (strings) to display in the result when running or showing a query.
  • kwds - The columns of the database are all keywords. For a database table/column structure dictionary, call graph_db_info. Keywords accept both single values and lists of length 2. The list allows the user to specify an expression other than equality. Valid expressions are strings, and for numeric values (i.e. Reals and Integers) are: ‘=’,’‘,’‘,’=’,’=’. String values also accept ‘regexp’ as an expression argument. The only keyword exception to this format is induced_subgraphs, which accepts one of the following options: 1. [‘one_of’,String,...,String] Will search for graphs containing a subgraph isomorphic to any of the graph6 strings in the list. 2. [‘all_of’,String,...,String] Will search for graphs containing a subgraph isomorphic to each of the graph6 strings in the list.

EXAMPLES:

sage: Q = GraphQuery(display_cols=['graph6','num_vertices','degree_sequence'],num_edges=['<=',5],min_degree=1)
sage: Q.number_of()
35
sage: Q.show()
Graph6               Num Vertices         Degree Sequence
------------------------------------------------------------
A_                   2                    [1, 1]
BW                   3                    [1, 1, 2]
CK                   4                    [1, 1, 1, 1]
CF                   4                    [1, 1, 1, 3]
CL                   4                    [1, 1, 2, 2]
CN                   4                    [1, 2, 2, 3]
D_K                  5                    [1, 1, 1, 1, 2]
D?{                  5                    [1, 1, 1, 1, 4]
D@s                  5                    [1, 1, 1, 2, 3]
DBg                  5                    [1, 1, 2, 2, 2]
D`K                  5                    [1, 1, 2, 2, 2]
D@{                  5                    [1, 1, 2, 2, 4]
DIk                  5                    [1, 2, 2, 2, 3]
DBk                  5                    [1, 1, 2, 3, 3]
DK[                  5                    [1, 2, 2, 2, 3]
E@Q?                 6                    [1, 1, 1, 1, 1, 1]
E_?w                 6                    [1, 1, 1, 1, 1, 3]
E?N?                 6                    [1, 1, 1, 1, 2, 2]
E_Cg                 6                    [1, 1, 1, 1, 2, 2]
E?Bw                 6                    [1, 1, 1, 1, 1, 5]
E?Fg                 6                    [1, 1, 1, 1, 2, 4]
E@FG                 6                    [1, 1, 1, 2, 2, 3]
E?NG                 6                    [1, 1, 1, 1, 3, 3]
E@N?                 6                    [1, 1, 2, 2, 2, 2]
E@YO                 6                    [1, 1, 2, 2, 2, 2]
E@QW                 6                    [1, 1, 1, 2, 2, 3]
E_Cw                 6                    [1, 1, 1, 2, 2, 3]
E_Ko                 6                    [1, 1, 2, 2, 2, 2]
FK??W                7                    [1, 1, 1, 1, 1, 1, 2]
F_?@w                7                    [1, 1, 1, 1, 1, 1, 4]
F??^?                7                    [1, 1, 1, 1, 1, 2, 3]
F_?Hg                7                    [1, 1, 1, 1, 1, 2, 3]
F?LCG                7                    [1, 1, 1, 1, 2, 2, 2]
F_?XO                7                    [1, 1, 1, 1, 2, 2, 2]
FK?GW                7                    [1, 1, 1, 1, 2, 2, 2]
graph_db_info() 
       
{'graph_data': ['complement_graph6', 'eulerian', 'graph6',
'lovasz_number', 'num_cycles', 'num_edges',
'num_hamiltonian_cycles', 'num_vertices', 'perfect', 'planar'],
'degrees': ['degree_sequence', 'min_degree', 'max_degree',
'average_degree', 'degrees_sd', 'regular'], 'spectrum': ['spectrum',
'min_eigenvalue', 'max_eigenvalue', 'eigenvalues_sd', 'energy'],
'misc': ['vertex_connectivity', 'edge_connectivity',
'num_components', 'girth', 'radius', 'diameter', 'clique_number',
'independence_number', 'num_cut_vertices', 'min_vertex_cover_size',
'num_spanning_trees', 'induced_subgraphs'], 'aut_grp':
['aut_grp_size', 'num_orbits', 'num_fixed_points',
'vertex_transitive', 'edge_transitive']}